Building a simple analytics and tracking solution for the web using Azure Storage

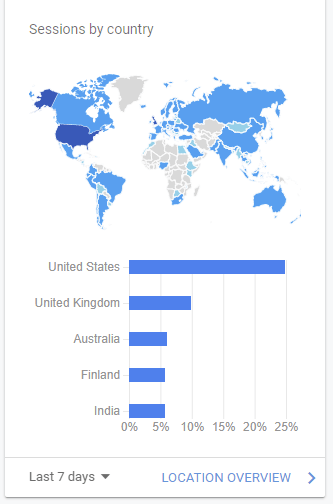
I use Google Analytics on this blog, and I guess it’s the industry standard. It’s free and very easy to configure – you inject a bit of JavaScript on the page, and that’s it. You get a lot of analytics and statistics, such as sessions by country:
And, nice graphics that give motivation to continue writing, when you see people are finding the content useful:
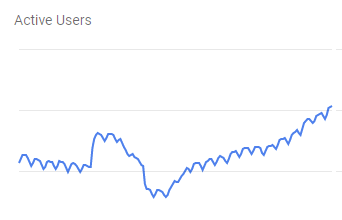
(Sorry, I’m too shy to reveal actual numbers – perhaps, someday!)
The apparent downside is that Google will fiercely crunch down all data and metadata I’m indirectly providing, and probably benefiting on that elsewhere. I remember reading from the fine people at Basecamp, that they finally grew tired of Google’s massive reach and just built their own solution for web analytics and tracking. I don’t have that kind of stamina or capacity, but what I do have is an endless thirst to learn.
So, yesterday, when I was done with all work and family duties, I poured myself a glass of some Italian red wine and started testing if I could build a plain analytics solution without writing a single line of code. And in just 30 minutes I was able to do get something together. It’s very barebones, but a nice base for building some more serious in the future. The road to great solutions is littered with dozens of abandoned pet projects, I guess.
I chose not to remove Google Analytics, as I find it massively useful and I have no lucid fantasies of my own solution ever replacing it.
Building and planning the solution
I only had about an hour before I needed to go to bed (I like my sleep), so I did the planning while I was building the solution. Perhaps don’t do this yourself.
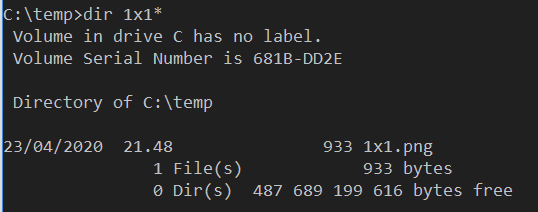
First, I did a very quick refresher on tracking pixels. They are the 1×1 images, that you host elsewhere and use the referrer data to gather your statistics. You can find a nice overview of the usage here. I used Paint.NET to create a 1×1 PNG file and stored it locally for now.
I then created a skeleton HTML to test out this simple solution:
<html>
<head>
<title>Hey</title>

<!-- tracking pixel -->
<img src="C://temp/1x1.png"></img>
</head>

<p>hello, world</p>

</html>
I was immensely pleased that it worked on the first try. “Don’t code bugs” was one of the first lessons I learned when I started out as a young consultant back in 199..something.
I also checked that I can embed the <img> tag easily within this blog. In WordPress I use the Satollo plugin that allows me to inject custom content in Head, Footer and Posts under Settings > Header and Footer:
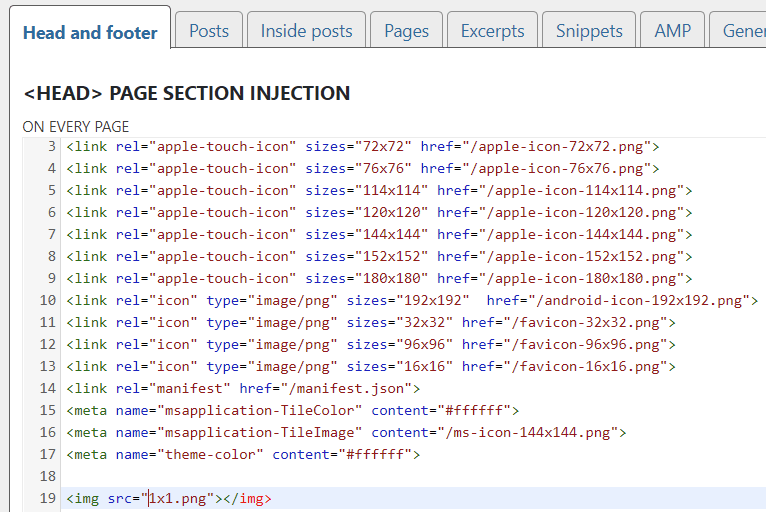
Obviously, the source is not correct, so I didn’t save this just yet. Just ascertaining that this wouldn’t be a blocker down the road.
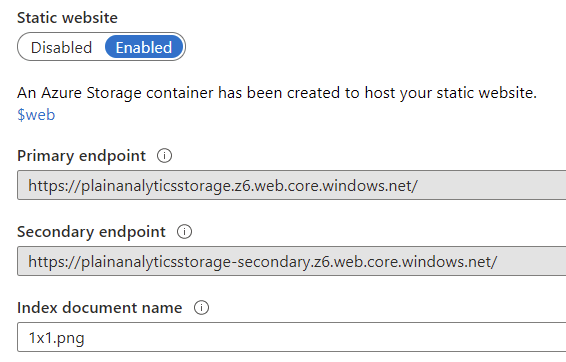
To host the tracking pixel, I provisioned a Storage Account in one of my Azure subscriptions. You can use fancy command-line tools, or just provision it through Azure Portal to get going. I then enabled the Static website option for the storage account. This automatically provisions a new container called $web where I uploaded the 1×1.png tracking pixel.
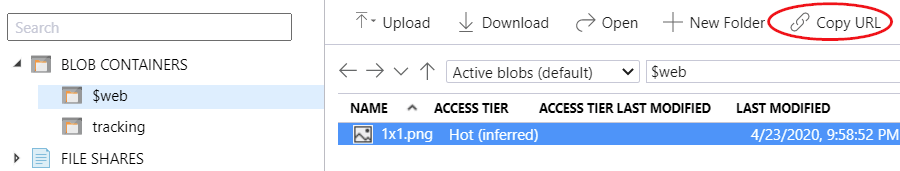
Using Storage Explorer, I can view how it looks and copy a working URL for testing.
I tested with my previous locally hosted HTML file, and it worked flawlessly:
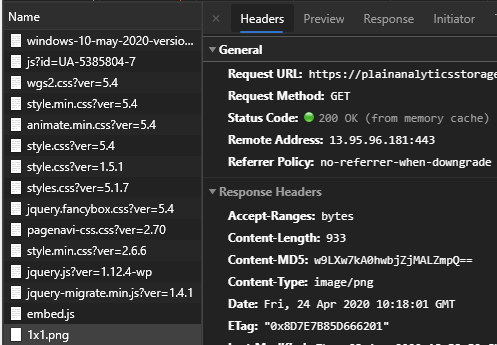
<img src="https://plainanalyticsstorage.z6.web.core.windows.net/1x1.png"></img>I then injected this URL to my WordPress header. If you check the network traffic for any page at jussiroine.com, you can see that the tracking pixel is loaded:
So, the wiring up is done. Now all that is left is to get some statistics! I played around here a bit before finding what I needed.
Within the storage account, you can view Metrics (and there is also Metrics (classic) now, which you don’t need). Filter for Egress traffic, and then add a filter for API Name = ‘GetWebContent‘
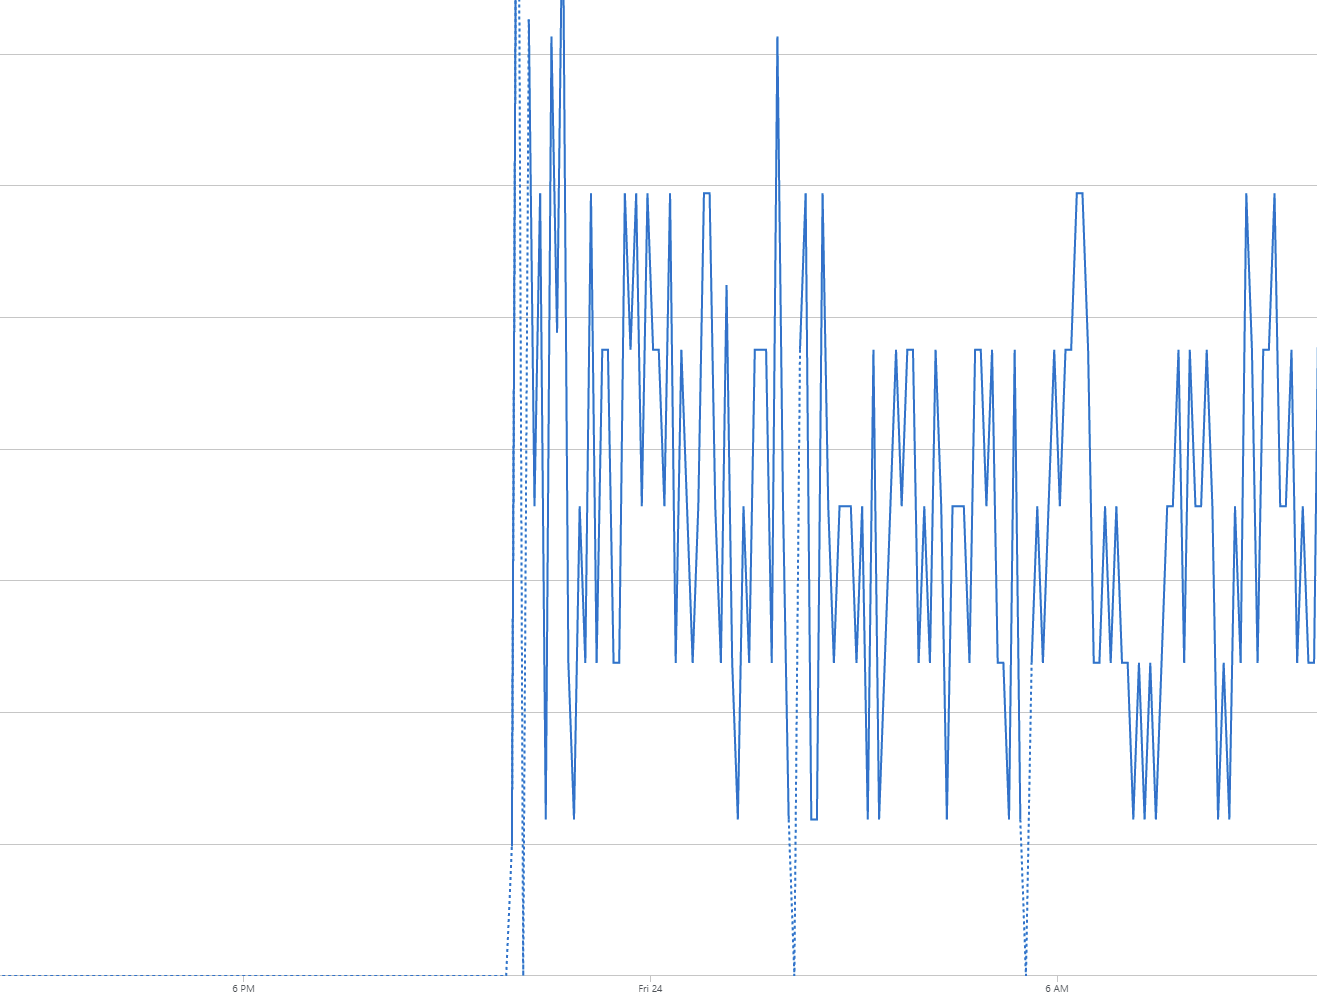
The tracking pixel works! And gives me.. something. To further understand the analytics, I found that by using the new Insights (preview) capability I can dig deeper:
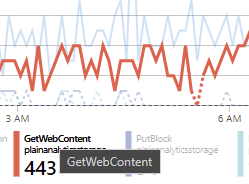
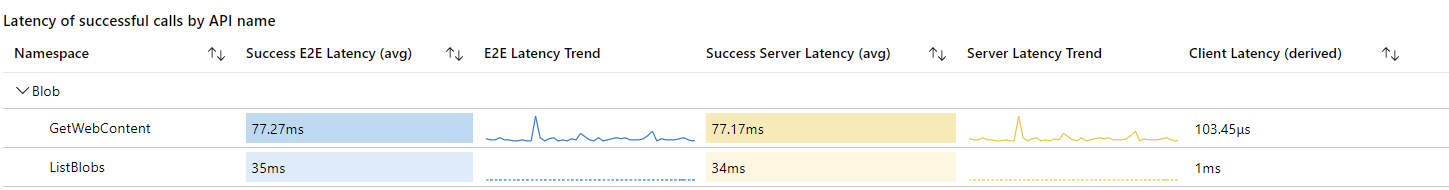
443 calls to the tracking pixel during the night! But, I still need metadata about this – a bit like what Google Analytics gives me. I spent some more time digging through the metrics, and the Storage Account Insights certainly give a lot of data – but it’s very generalized, and I couldn’t parse anything of use for this scenario. Here is an example:
What I then found out is that I didn’t have logging enabled for the storage account. I enabled this (see here for guidance) under Diagnostic Settings:
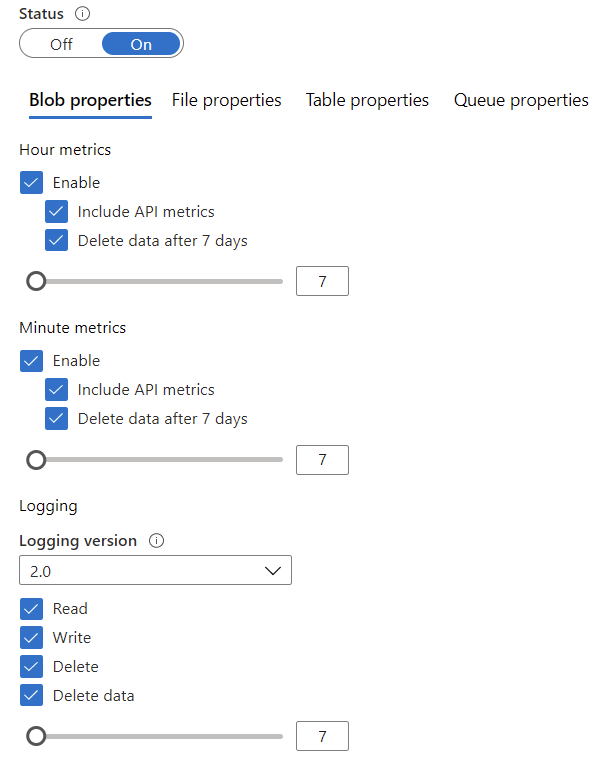
The beauty of this is that logging is automatic, and I can automatically prune older logs. I left it at defaults, so hourly metrics will be removed after 7 days. Turning on diagnostics creates a hidden container named $logs, which is not visible in Storage Explorer of Azure Portal. You must use an API, or the standalone Storage Explorer app to browse the logs. You can then view the day-by-day containers and choose what logs to look at:
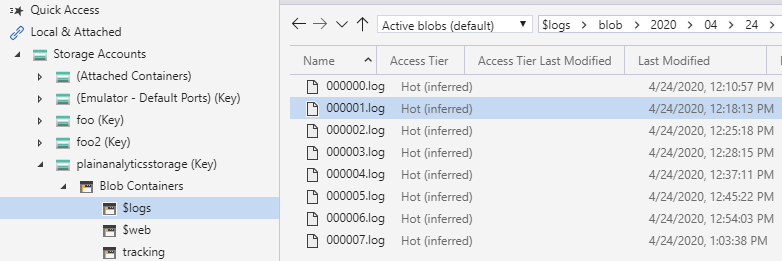
I picked up one log file, imported that to Excel, as the data format is a classic CSV. And here we have our data!
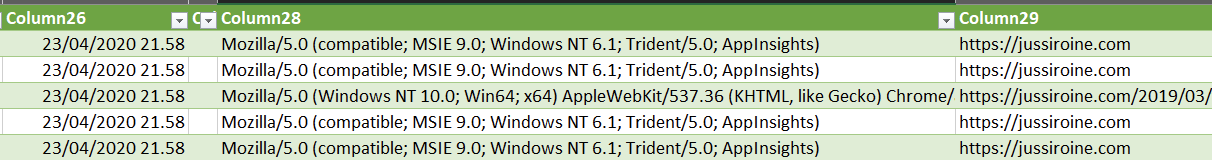
It’s trivial now to leverage these logs to build a custom Power BI dashboard, or craft a real database out from all the logs that are now being accumulated.
In conclusion
What a fun way to spend the evening! Building custom analytics and tracking solution without writing a single line of code was something I didn’t think would be possible. This is the skeleton implementation, and perhaps I’ll work on creating the end-to-end integration from the logs to Power BI at some point. For now, I hope this inspires others to build something similar, too!