Understanding Developer Velocity to achieve better business performance

I’ve been taking a few vacation days this week. That is probably one of the considerable differences for me – last year I was still a business owner and entrepreneur, so vacation days simply meant getting more work done without interruptions. Now as an employee I get to use these days for recharging and relaxing. We visited the gym in the morning with my wife, prepped a nice lunch and now I’m enjoying the warm winds from the sea while sitting on my balcony.
For me, pausing to think and digest is one of the best forms of learning and advancing my own reflections. Microsoft Build 2020 has just wrapped, and I’ve had a chance to go through the announcements and new releases – even if just briefly and haphazardly so far. Thankfully, summer is just around the corner and it gives more time to dive deep into details and build prototypes and solutions.
One of the things that were announced during Build 2020, which I wanted to understand better was Developer Velocity Index (DVI). You can read the announcement here.
What is Developer Velocity?
McKinsey recently published their report on Developer Velocity (you can view it here), and it’s a great read. Direct link to the report.
The report is 11 pages, and it outlines that Developer Velocity is when business performance improves through empowering developers, providing them with the right tools and abilities to innovate. Often this simply means removing friction and artificial red tape and trusting your developers.
The rest of the report outlines a survey that was conducted on 440 large enterprises, and over 100 interviews. It’s also interesting, but your definition of a large enterprise might differ from mine – so perhaps take a look at the charts yourself.
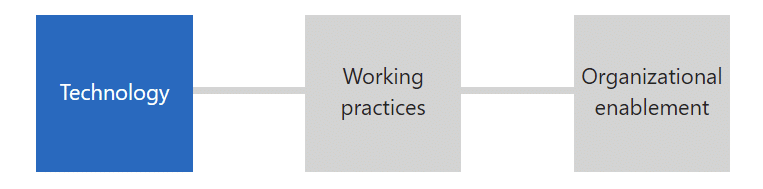
What McKinsey found out is that Developer Velocity involves 46 drivers, across 13 dimensions. The three main categories are technology, working practices, and organizational enablement. Technology includes the usual suspects such as architecture, testing, and tools. Working practices include security and compliance, the use of open-source (and InnerSource), and whether Agile team practices are employed. And organizational enablement includes things such as culture, talent and product management, and team characteristics.
McKinsey then formulated DVI, or Developer Velocity Index based on these findings. It takes into account the 46 drivers and 13 dimensions, uses something called Johnson’s Relative Weights analysis to quantify these findings into a DVI score.
Microsoft contributed to the research, and there is also a nice overview page on the findings here. To summarize, a higher DVI equals faster revenue growth, higher returns to shareholders, and better operating margins.
Measuring your Developer Velocity Index
Now that we have a better understanding of what DVI is, we can measure it for our organizations. Microsoft implemented a tool, called the Developer Velocity Assessment, which you can now use to get a DVI score. My understanding is that the tool is based on the McKinsey findings and raw data, and thus reflects closely to the findings.
You can access the Developer Velocity Assessment here. It takes about 15 minutes to fill out, and I would encourage you to be thoughtful enough when filling out the three pages.
I filled out the assessment by wearing my “two guys and a dog” hat on. Thus, I reflected on some of the ambitions I’ve had for a few pet projects to reveal what my DVI score would be. It became evident soon that the assessment is really aimed for enterprises; answer choices such as “Security and DevOps teams collaborate on threat models” were hard to answer properly.
The survey covers the three categories, and also requires you to sign in before filling it out. My DVI score was 3.4, while the industry (Software, which I chose) average is 2.9. It breaks down like this:
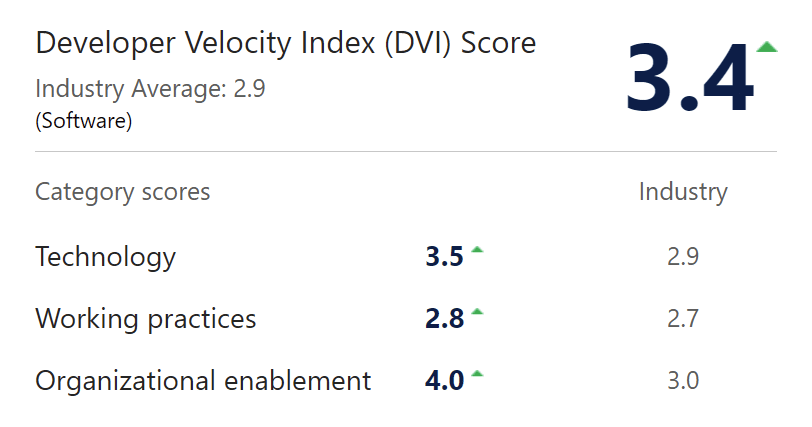
Working practices got the lowest scores, perhaps due to the fact that I could only think of scenarios where two people are involved, so scalability and extensive peer reviews were not among the top choices.
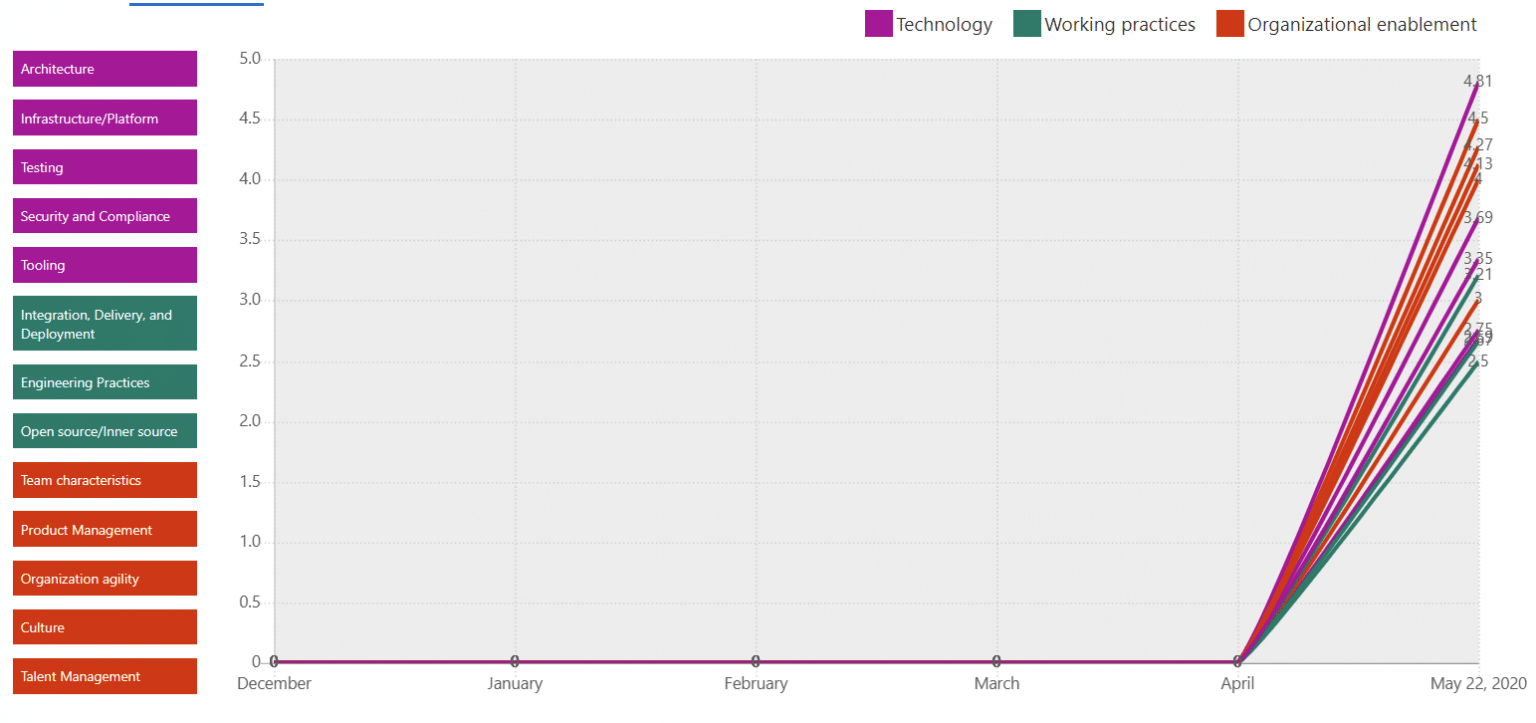
The answers are then broken down in sub-categories:
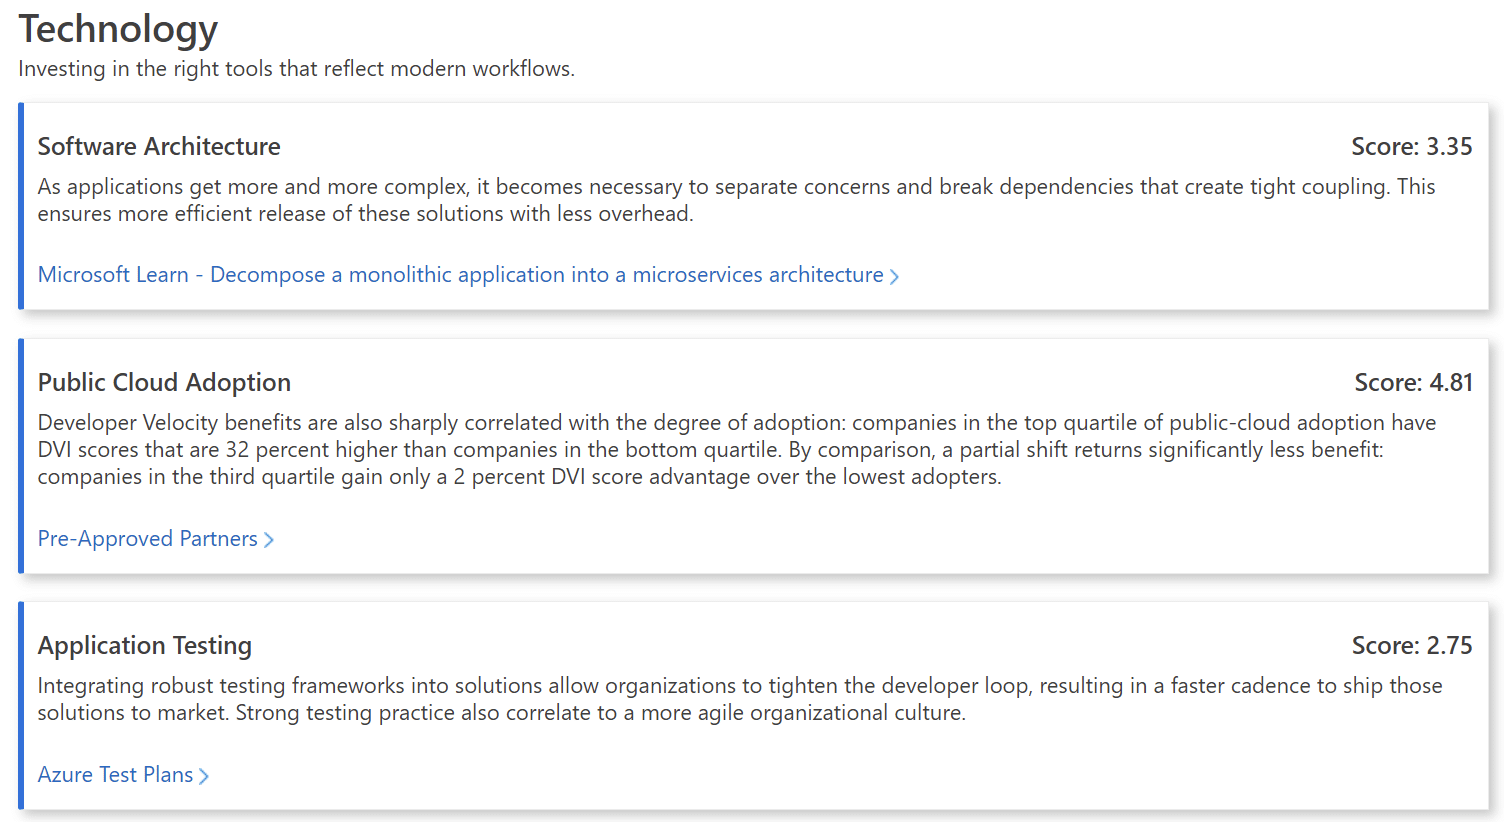
And each category is also explained in more detail, with relevant links to corresponding resources:
There is also an option to download the DVI score report as a PDF file.
In summary
The idea with the assessment is great, as anyone can now generate their DVI score and use that for working towards a better Developer Velocity. You could use the report with a preferred partner, or within your team and leverage the provided resources – which, by the way, all seem to be free.
Jussi Roine
Microsoft MVP and consultancy founder with 30+ years of experience, passionate about Microsoft security, AI governance, and sharing what I learn along the way.